The FlexMeasures data model
The data model being used in FlexMeasures is visualized here (click for larger version):
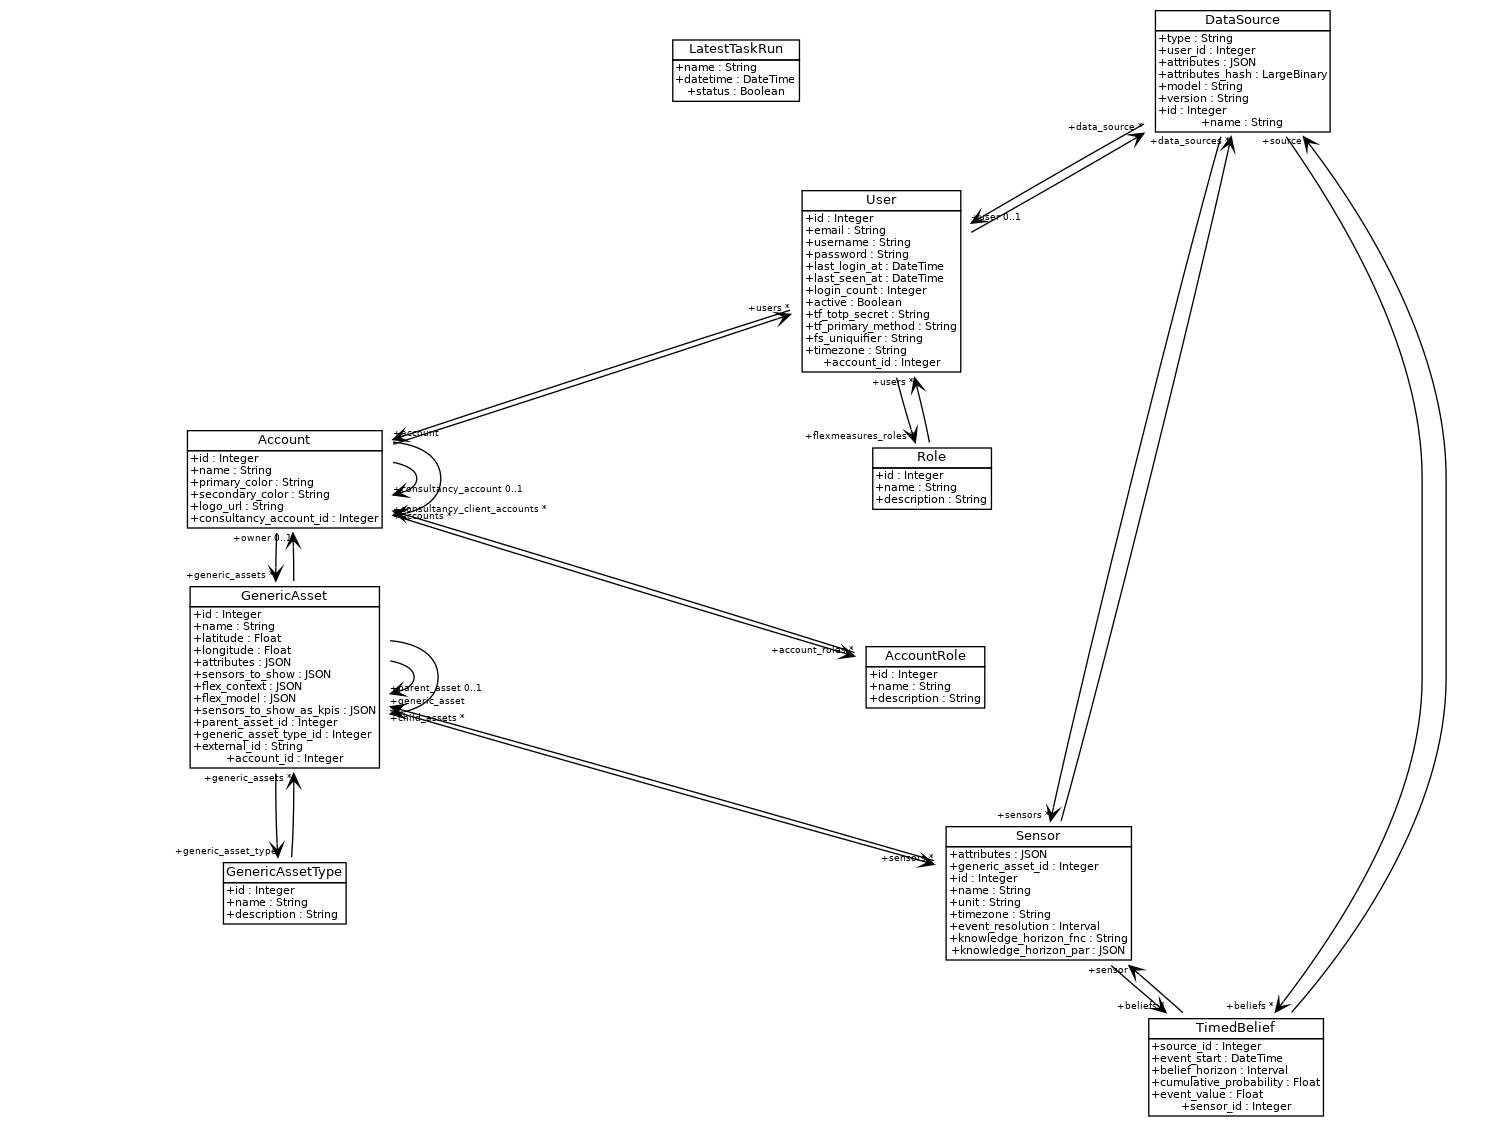
Let’s dive into some of the more crucial model types:
Assets
Assets can represent physical objects (e.g. a car battery or an industrial machine) or “virtual” objects (e.g. a market). In essence, an asset is anything on which you collect data.
Assets can also have a parent-child relationship with other assets. So, you could model a building that contains assets like solar panels, a heat pump and EV chargers.
Sensors
A sensor depicts how data is collected in detail. Each sensor links to an asset.
For instance, an asset might have both a energy meter and a temperature reading. You’d link two sensors to that asset and each sensor would have a unique unit (e.g. kWh and °C).
You can also tell FlexMeasures in what timezone your data is expected to be set, and what the resolution should be. Then, FlexMeasures can try to convert incoming data to these specifications (e.g. if Fahrenheit readings come in, it converts them to Celsius).
A bit more intricate control is to describe when beliefs (see below) are known. You might get prices from a supplier, but the time you imported them is not the time they were known. A market might have a publication date you want to adhere to. More information in the timely-beliefs documentation.
Data sources
We keep track of where data comes from, for better reporting (this is also an aspect of the timely-beliefs package). A data source can be a FlexMeasures user, but also simply a named source from outside, e.g. a third-party API, where weather forecasts are collected from.
Beliefs
When we discussed sensors, we hinted at the care we took to model the event data well. We call each data point a “belief”, as we not only store measurements ― we also store forecasts, schedules and the like, many of which do not have a 100% truth value.
For instance, a horizon of 0 means the data point was known right after it happened. A positive horizon means the data point is a forecast.
The timely-beliefs package helps us to model many aspects about data points, e.g. who claims to know that value, when they said so and how certain they were.
Each belief links to a sensor and a data source. Here are two examples:
The power sensor of a battery, where we store the schedules, can have two sources: (1) the schedule itself (a data source of type “scheduler”, representing how FlexMeasures created this data) and (2) the realized schedule, i.e. the measurements of how the battery responded (or not) to the schedule. The latter might have a data source of type “user” (who sent the measurements to FlexMeasures).
A thermal demand sensor containing forecasts (data source of type “forecast”, e.g. heating usage forecast sent to FlexMeasures or made by FlexMeasures) and measurements (sent into FlexMeasures, data source type “user”).
Accounts & Users
FlexMeasures is a multi-tenant system. Each account should model an organization with multiple users.
Accounts “own” assets, and data of these assets are protected against anyone from a different account (unless a user has the admin role).
Accounts can “consult” other accounts. This depicts the real situation that some organizations are the consultants or advisors to many others. They have certain rights, e.g. to read the data of their clients. That is useful for serving them. If you are hosting FlexMeasures, and the organizations you serve with it use this feature, you are effectively running a B2B2B setup :)